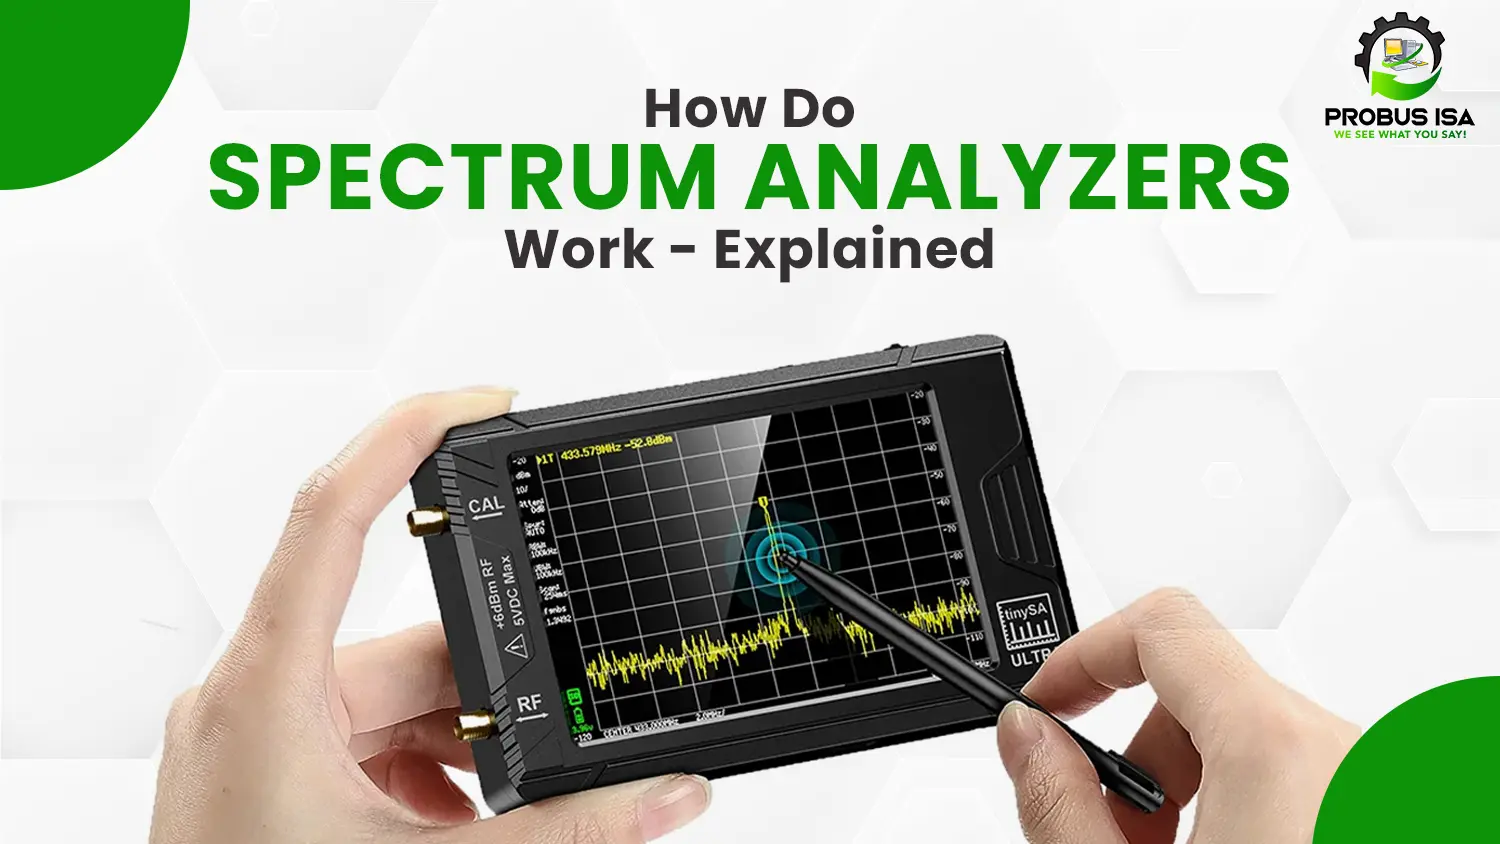
Spectrum analyzers are a must-need tool for engineers and technicians in the worlds of electronics and communications. They allow an accurate analysis of the frequency spectra, offering insights into signal strength, bandwidth, and interference.
Whether for testing and development but also for troubleshooting, being aware of the functioning of a spectrum analyzer will allow you to make its maximum use.
This blog explores the fundamental principles behind spectrum analyzers, their different types, and how they are used to measure and visualize signals.
What Is a Spectrum Analyzer?
A spectrum analyzer is an electronic device used to measure the magnitude of an input signal versus its frequency. It helps reveal the parts of the widest frequency bands in a signal and represents a graph of the power spectrum of the signal over frequency. Consequently, it is not only a useful tool for radio and audio signal engineers not only but also baseband signal engineers in wireless communication or sound engineering, and many other applications.
The spectrum analyzer displays the amplitude of different frequencies in a signal. This graphical output is typically represented as a plot with frequency on the horizontal axis and amplitude (or power) on the vertical axis.
Major Features of Spectrum Analyzers
There are a lot of features in a Spectrum Analyzer. The major ones are:
– Frequency Range
The frequency range of a spectrum analyzer means the range of frequencies the device can measure. For example, some spectrum analyzers may cover a range from 9 kHz to 3 GHz, while more advanced models may reach several terahertz.
– Resolution Bandwidth (RBW)
The resolution bandwidth determines the smallest frequency difference the analyzer can distinguish. A narrower RBW allows the analyzer to resolve finer details in the spectrum but may result in slower sweep speeds.
– Sweep Time
Sweep time is the time it takes for the analyzer to scan across a frequency range. Faster sweeps provide quicker measurements but may have reduced accuracy or resolution.
– Dynamic Range
The dynamic range defines the difference between the largest and smallest signals spectrum analyzers can detect. A higher dynamic range allows the analyzer to measure both weak and strong signals in the same measurement.
Types of Spectrum Analyzers
Spectrum analyzers come in various forms, depending on the application and frequency range. The two most common types are:
1. Analog Spectrum Analyzers
These were the first generation of spectrum analyzers and are usually used for analog signals. They rely on traditional analog circuitry to convert signals into readable frequency displays. Although older models are less common, they are still used in specialized applications.
2. Digital Spectrum Analyzers
Modern spectrum analyzers are digital and use fast Fourier transform (FFT) algorithms to convert time-domain signals into frequency-domain displays. Digital analyzers offer greater accuracy, flexibility, and ease of use compared to their analog versions. They can display spectra in real-time and handle complex signals with ease.
3. Real-Time Spectrum Analyzers (RTSA)
Real-time spectrum analyzers take digital spectrum analysis a step further. They continuously capture signals and offer the ability to analyze transient events that may occur for brief moments. This is useful for measuring intermittent signals, pulsed signals, and signals in dynamic environments.
How Do Spectrum Analyzers Work?
Now that we know the features and types of spectrum analyzers, let us look at how they work.
Signal Capture
The first step in the process is capturing the signal you want to analyze. This could be any electrical signal that varies with time, such as a radio wave, audio signal, or communication signal. A probe or antenna is used to introduce the signal into the analyzer.
Frequency Conversion
Once the signal enters the spectrum analyzer, it usually needs to be converted into a form that can be more easily analyzed. This is achieved using a heterodyne process. In this process, the signal is mixed with a reference signal (called a local oscillator) to shift its frequency down to an intermediate frequency (IF), making it easier to analyze.
This step involves a combination of filters, mixers, and amplifiers, making sure that only the relevant frequency components are retained.
Fourier Transform
After conversion, the signal is processed using a Fast Fourier Transform (FFT) algorithm. The FFT is a mathematical method that breaks down a complex signal into its individual frequency components. This transforms the signal from the time domain into the frequency domain.
In the frequency domain, you can see which frequencies are present in the signal, how much power they carry, and whether they are within acceptable limits for your application.
Signal Display
The data is then displayed on the screen, usually in the form of a graph. The x-axis represents frequency, and the y-axis represents the amplitude or power of the signal at that frequency. This visualization makes it easy to identify important characteristics such as signal strength, harmonic distortion, or interference.
You can adjust the frequency span (the width of the frequency range shown), RBW (the frequency resolution), and gain settings (to adjust sensitivity) to better examine the signal.
Measurement and Analysis
Once the signal is displayed, the analyzer can be used to perform specific measurements, including:
- Peak power: Maximum amplitude at a given frequency
- Average power: Average signal strength over a range of frequencies
- Signal-to-noise ratio (SNR): The ratio of signal strength to background noise
- Harmonic analysis: Identifying harmonic distortion in the signal
- Intermodulation distortion: Identifying interference between signals
Many modern analyzers also offer built-in software tools to automate these measurements, making the process more efficient.
Applications of Spectrum Analyzers
Spectrum analyzers are used in a wide range of fields, including:
- Telecommunications: Analyzing RF signals, testing transmitters and receivers, and making sure of proper signal quality.
- Wireless communications: Measuring spectrum usage and identifying sources of interference in crowded frequency bands.
- Electronics design and testing: Making sure of the performance of electronic components, such as filters, amplifiers, and oscillators.
- Broadcasting: Making sure that radio and television signals are transmitted within the correct frequency bands and with the required power levels.
- Research and development: Developing new wireless technologies and experimenting with signal processing techniques.
Choosing the Right Spectrum Analyzer
When selecting a spectrum analyzer, it is important to consider the following factors:
- Frequency range: Make sure the analyzer covers the frequency bands you are working with.
- Resolution bandwidth: A narrower RBW provides higher resolution, but may reduce sweep speed.
- Dynamic range: Choose a model with sufficient dynamic range to capture both weak and strong signals.
- Real-time capability: If you need to capture transient or intermittent signals, consider using a real-time analyzer.
- Portability: If you need to conduct measurements on the go, choose a portable or handheld model.
Final Words
Spectrum analyzers are great tools for engineers that give important information about the frequency content of electrical signals. By using sophisticated methods like FFT and heterodyne processing, these gadgets provide a clear and detailed view of complex signals which helps engineers and technicians to troubleshoot, make sure of quality, and improve performance. Be it testing communication equipment, designing new electronics, or troubleshooting interference issues, a spectrum analyzer is an invaluable instrument in your toolbox.
The next time you need to analyze the frequency spectrum of a signal, you will be able to better understand how spectrum analyzers work and why they are so important in the world of electronics and communications.